
Unbelievable performance from a simple stock selection approach.

Note: This post is more technical than usual and may be of interest only to specialists.
Economist Burton Malkiel, exploring the implications of the efficient market hypothesis,1 wrote in A Random Walk Down Wall Street that “a blindfolded monkey throwing darts at a newspaper’s financial pages could select a portfolio that would do just as well as one carefully selected by experts.”2 Empirical tests have supported Malkiel’s claim.3
While Malkiel may have intended his statement merely to illustrate a point about the implications of the efficient market hypothesis, it should not be overlooked that he was, in fact, providing a prescriptive method for stock selection that puts investors on par with experts. However, his dart-throwing monkey methodology has practical limitations. Monkeys can be dangerous,6 and some states, including our home state of Massachusetts, prohibit individuals owning monkeys as pets.7 In addition, darts, while legal, also pose health risks, including an estimated 675 emergency room visits per year.8
There is a gap in the market for a method for generating passive portfolios that does not suffer from the legal and safety defects of blindfolded monkeys throwing darts. A smartphone app has been developed that simulates dart-throwing monkeys.9 However, the app does not work with IOS 11 and does not price securities in US dollars. Index mutual funds and ETFs might be considered a substitute for dart-throwing monkeys as they are similarly premised on the inability of active managers to do better than chance. But index funds are dull. We observe that on Youtube, the top clip advocating index investing is an interview with Warren Buffet that has garnered 175 thousand views. To put this in perspective, a simple video of a surprised cat has garnered over 78 million views.
These statistics suggest an opportunity to both overcome the safety and legal limitations of Malkiel’s monkey-dart approach and to advance investor awareness of the efficient market hypothesis. We challenged our financial engineers and marketing department to work together to develop a solution. They came back with a simple, breakthrough proposal: replace Malkiel’s dart-wielding monkeys with painted-paw cats. We describe the experiment and its results below.
Methodology
We selected as a test subject a 5-year old Maine Coon cat and two pages of stock listings from the March 14, 2018 edition of the WSJ. We painted the subject’s paws with non-toxic paint consistent with NIH animal test guidelines.10 The subject was placed on the newspaper and allowed to walk at its own discretion until approximately 60 stocks were marked with paint.
From this initial selection, we eliminated those securities that were not constituents of the S&P 500 Index as of January 1, 2010, then constructed an equal-weighted portfolio of the remaining 53 securities.10.5
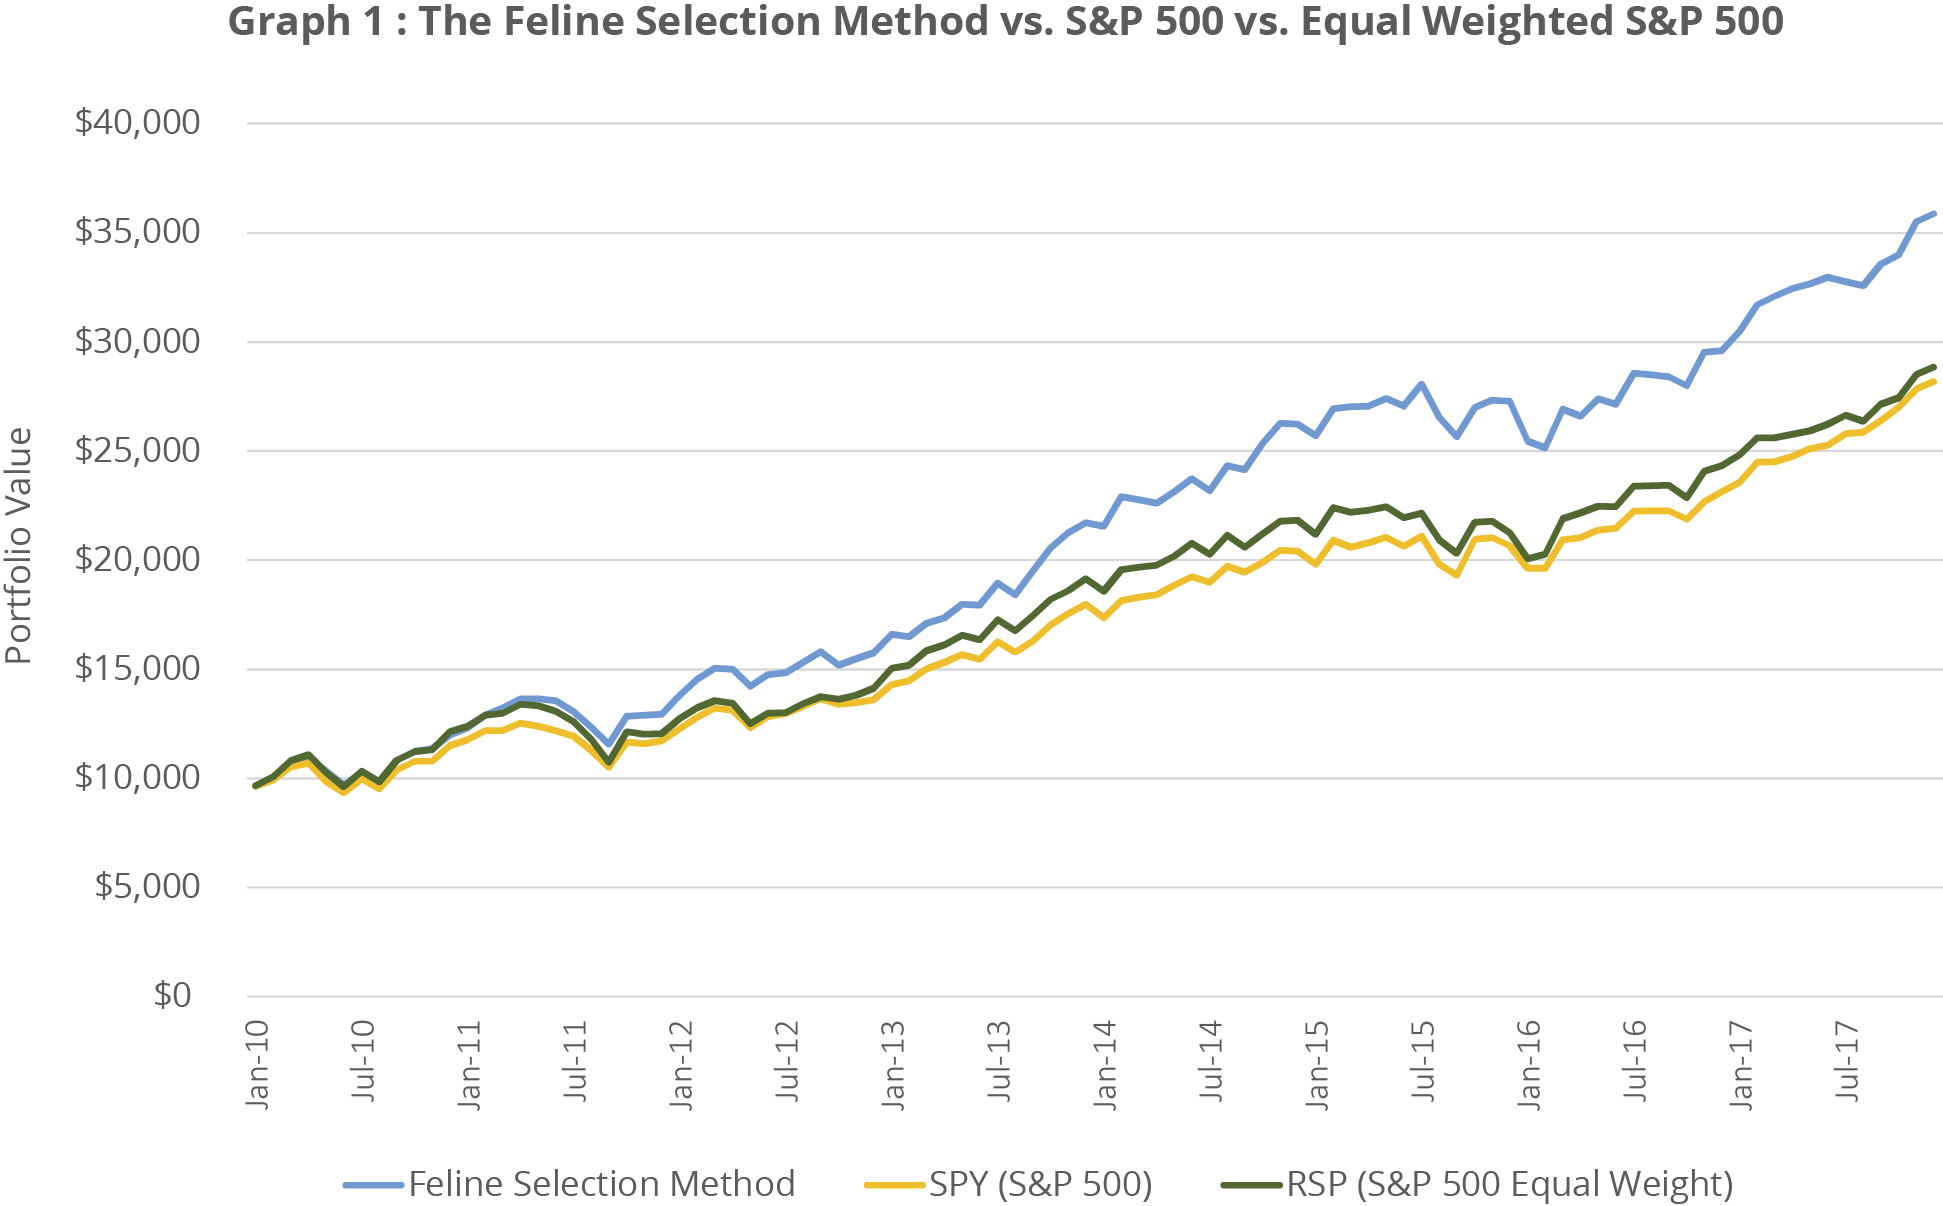
We then calculated the eight-year returns of this portfolio, without rebalancing, from 1/1/2010 to 12/31/ 2017. We compared the returns of the feline-selected, equal-weighted portfolio (FSP) with the returns of two ETFs: SPY, which tracks the S&P 500; and RSP, which tracks an index constructed by equally weighting the components of the S&P 500 index. Because FSP is equally weighted, we consider RSP to be the more appropriate benchmark.
Some Notes on Methodology
- The experiment has low statistical power because of the small sample size (n = 1).
- We declined to join the “preregistration challenge.” The analyses were not pre-registered, the data were not collected by independent researchers and the results were not analyzed by independent statisticians in a blinded data set.
- In contravention of standard experimental protocols, we ran the experiment repeatedly until we got the results we desired, thus creating the risk of selection bias.
- The procedure of selecting a group of securities at the end of a test period and then excluding all those that were not in a large cap index at the beginning of the test period suffers from survivor bias. In particular, it excludes from the tested portfolio any company that declined in value enough to be dropped from the S&P 500. It may be challenging to replicate this ex post screen ex ante.
- The experiment was not double blind. Both the subject and the testers were able to see the listings.
- The selected securities will have an alphabetical clustering bias, as the securities are printed in the newspaper in alphabetical order, and the cat’s paw spans the width of several listings. We cannot dismiss the possibility that securities with alphabetical proximity will show correlated returns.
- The results have not been peer reviewed.
Results
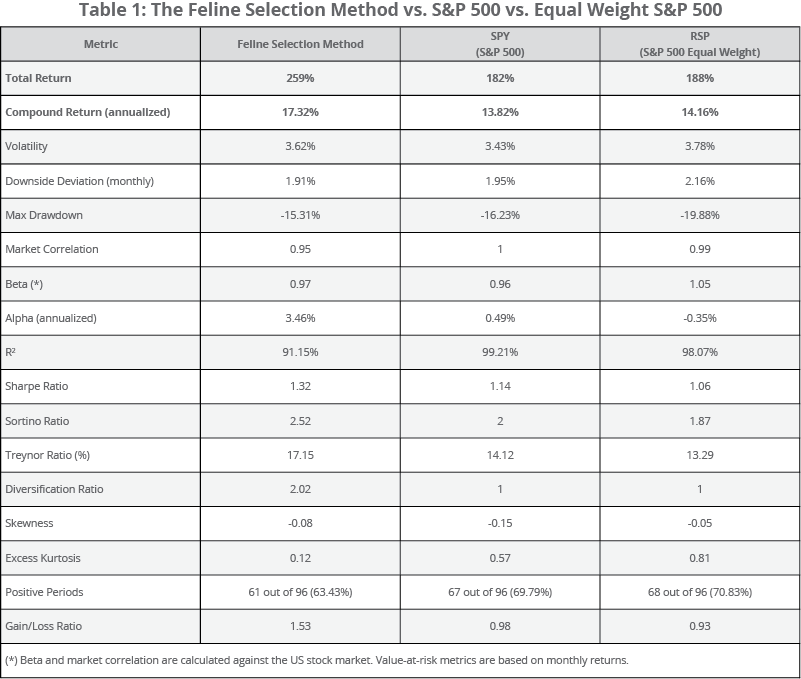
The Feline Selected Equal-weighted Portfolio, FSP, had a total return over the eight year period of 259% (17.32%/year), compared to 188% (14.16%/year) for RSP and 182% (13.82%/year) for SPY. In addition, FSP has superior Sharpe, Sortino and Treynor Ratios. Most strikingly, FSP had lower excess kurtosis.11 See graph and table below.
Analysis
The backtest performance of the FSP test portfolio demonstrates the power of the the feline selection method. Nearly a third of American households own cats12 and therefore, through the Feline Selection method, have access to a method for superior portfolio construction. We conjecture that, with minor modifications, a similar methodology could be utilized by dog owners, as well.
All of the performance results are calculated on a pre-tax basis. Most cat owners are taxable entities, and therefore after-tax would be a more relevant metric. Future extension of the current study will include tax analysis. We note, however, that the Feline Selected Portfolio is a form of a direct index, which when properly tax managed is exceptionally tax efficient.13 We further note that prior to the invention of the Feline Selection Method, investors lacked a practical means to create a direct index portfolio.16
Conclusion
The average individual investor significantly underperforms the average equity fund,14 which, in turn, significantly underperforms index returns.15 This study provides evidence that the Feline Selection Method outperforms both.
While Malkiel’s dart-wielding monkey methodology was groundbreaking and justly celebrated when first introduced, it is our expectation that it will be rapidly displaced by the superior Feline Selection Method.
1 https://en.wikipedia.org/wiki/Efficient-market_hypothesis
2 Burton G. Malkiel (2007). “A Random Walk Down Wall Street: The Time-Tested Strategy for Successful Investing”, p.24, W. W. Norton & Company. Purchase at Amazon, Goodreads, BN
3 https://www.tandfonline.com/doi/abs/10.1080/758536475
4 We didn’t have time to correct for misnumbered footnotes, so we left this as a placeholder
5 Ibid.
6 http://www.humanesociety.org/assets/pdfs/wildlife/captive/primate-escapes-and-attacks.pdf
7 http://www.bornfreeusa.org/b4a2_exotic_animals_state.php?s=ma#2.12
8 https://www.ncbi.nlm.nih.gov/pmc/articles/PMC1285811/
9 https://itunes.apple.com/us/app/stock-picking-darts-invest-with-your-pet-monkey/id495510614?mt=8
10 https://grants.nih.gov/grants/olaw/guide-for-the-care-and-use-of-laboratory-animals.pdf
10.5 The portfolio constituents were DLR, ILMN, MCO, VMC, BMY, IBM, PRGO, XL, ALXN, FFIV, IDXX, LMT, MS, NEE, LUV, ULTA, VLO, KSS, MU, MSI, PH, PFE, STX, DHR, DRI, XOM, GRMN, GT, MYL, XEL, APH, CTAS, FDX, FLIR, SBUX, APC, NRG, PWR, URBN, HRS, HAS, VRSK, VRTX, AMZN, JEC, L, PRU, SIG, TDC, MO, AXP, CVS, and ITW
11 Yes, we know what it means. No, we don’t actually care.
12 https://www.avma.org/KB/Resources/Statistics/Pages/Market-research-statistics-US-pet-ownership.aspx
13 https://www.smartleaf.com/our-thinking/smartleaf-blog/direct-indexes-are-better-than-etfs
14 http://news.morningstar.com/articlenet/article.aspx?id=810470
15 https://us.spindices.com/spiva/#/reports
16 Smartleaf’s subsidiary, Smartleaf Asset Management, has developed a series of Direct Index Models that can also be used for this purpose
IMPORTANT INFORMATION
Smartleaf is not an investment management organization. This information is not investment advice, though may be deemed a financial promotion in non-U.S. jurisdictions. Accordingly, where used or distributed in any non-U.S. jurisdiction, the information provided is for Professional Clients only. This information is not for onward distribution to, or to be relied upon. For marketing purposes only. Any statements and opinions expressed are as at the date of publication, are subject to change as economic and market conditions dictate, and do not necessarily represent the views of Smartleaf or any of its affiliates. The information has been provided as a general market commentary only and does not constitute legal, tax, accounting, other professional counsel or investment advice, is not predictive of future performance, and should not be construed as an offer to sell or a solicitation to buy any security or make an offer where otherwise unlawful. The information has been provided without taking into account the investment objective, financial situation or needs of any particular person. Smartleaf and its affiliates are not responsible for any subsequent investment advice given based on the information supplied. This is not investment research or a research recommendation for regulatory purposes as it does not constitute substantive research or analysis. To the extent that these materials contain statements about future performance, such statements are forward looking and are subject to a number of risks and uncertainties. Information and opinions presented have been obtained or derived from sources which Smartleaf believed to be reliable, but Smartleaf makes no representation to its accuracy and completeness. Smartleaf accepts no liability for loss arising from use of this material. If nothing is indicated to the contrary, all figures are unaudited. Any indication of past performance is not a guide to future performance. The value of investments can fall as well as rise, so investors may get back less than originally invested. Not for distribution to, or use by, any person or entity in any jurisdiction or country in which such distribution or use would be contrary to local law or regulation. This information may not be distributed or used for the purpose of offers or solicitations in any jurisdiction or in any circumstances in which such offers or solicitations are unlawful or not authorized, or where there would be, by virtue of such distribution, new or additional registration requirements. Persons into whose possession this information comes are required to inform themselves about and to observe any restrictions that apply to the distribution of this information in their jurisdiction. The investment products and services mentioned here are not insured by the FDIC (or any other state or federal agency), are not deposits of or guaranteed by any bank, and may lose value. This information should not be published in hard copy, electronic form, via the web or in any other medium accessible to the public, unless authorized by Smartleaf. This information is approved for Global distribution.
No animals were harmed during the production of this report.

COMMENTS